
Overview
A multinational product-as-a-service business handling millions of microtransactions wanted to explore how GenAI could turn customer feedback into useful insights.
As the service designer alongside a business expert and an AI engineer, I helped define 'insight' for their organisation-specific: what, to whom and how. I translated those findings into a dashboard’s functionality and structure.
- Role
- Service designer
- Timeline
- 2025
Project highlights
Project
- Dozens of stakeholder interviews across organisational roles.
- A dashboard for spotting and investigating service issues.
- One proof of concept connecting complaints with operational data, with an initial chat capability.
My contribution
Research and workshop planning, interviews, tools and data mapping, synthesis, problem definition, and dashboard design.
Understanding what made an insight useful
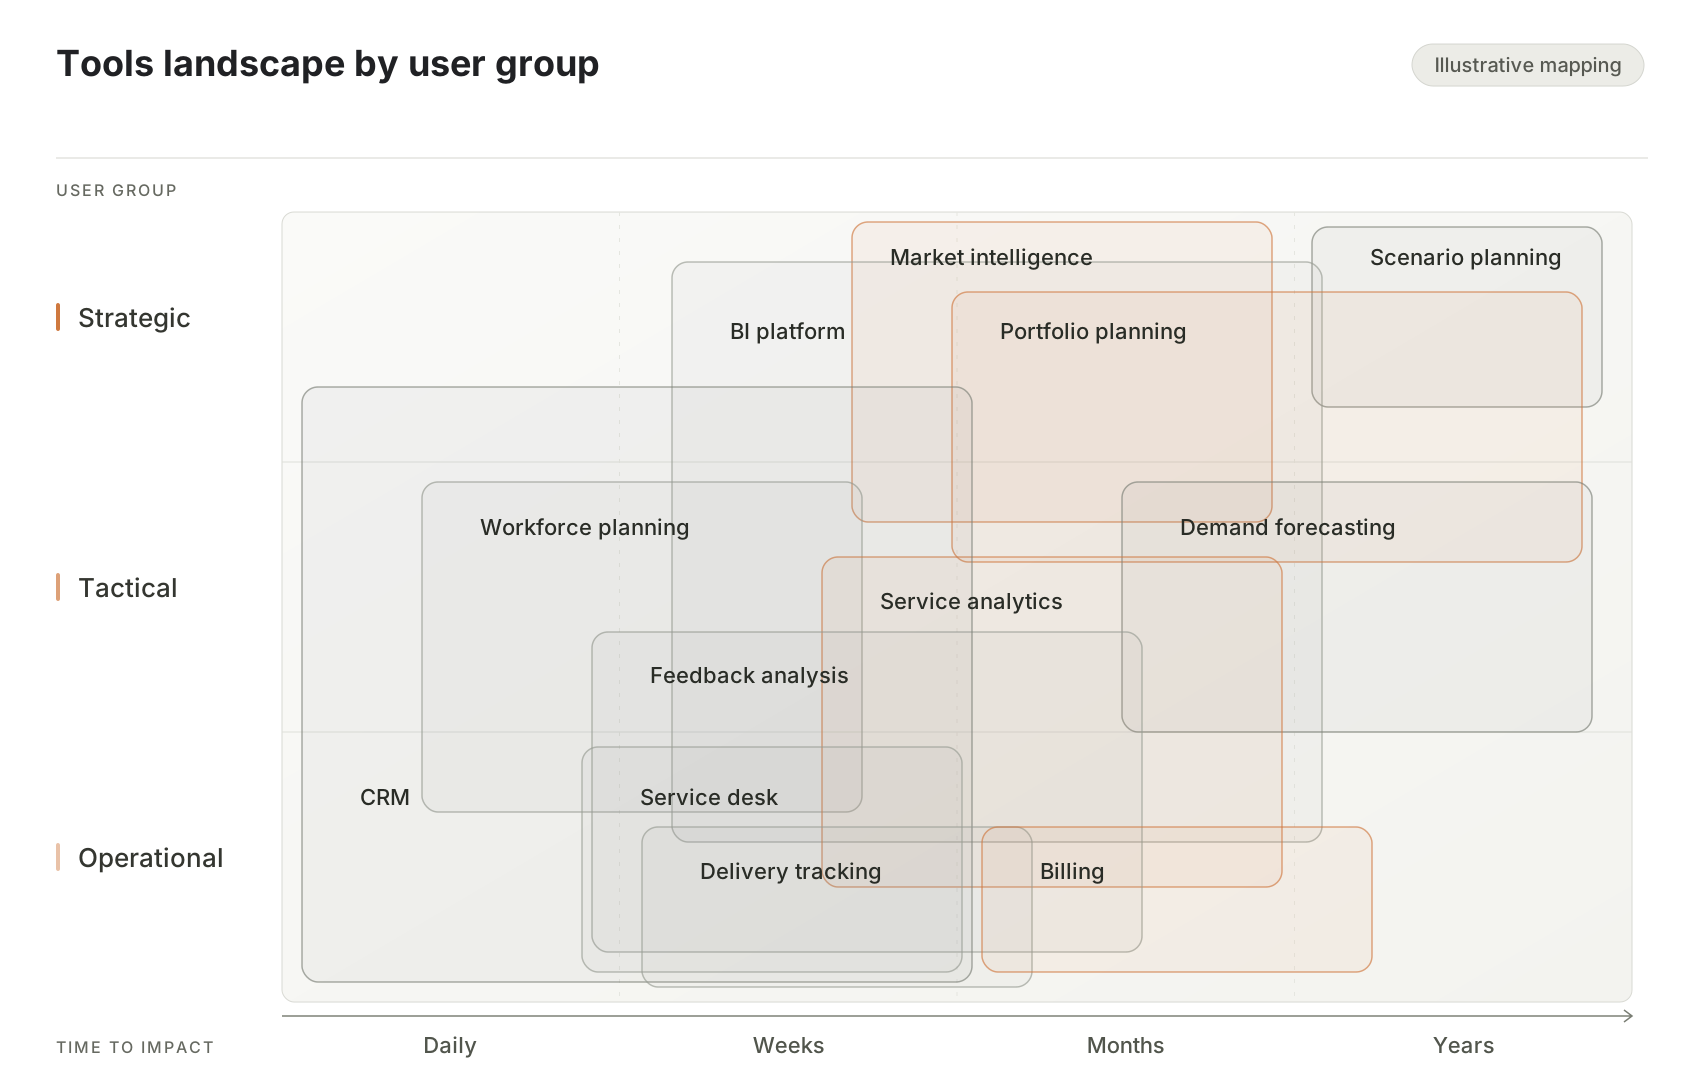
“Insight” meant different things across the organisation. We explored needs across operational, tactical and strategic roles to understand what information people required and which decisions it supported.
I mapped their tools and data to identify gaps. Sometimes the missing information sat in another tool they could not access. Elsewhere, it was available but difficult to navigate or extract. These findings helped define who the dashboard would serve and how.
Choosing root cause analysis
We prioritised root cause analysis for its potential to support daily operations and reveal recurring issues. Focusing on individual cases could leave underlying causes unresolved, while portfolio-level insights involved long feedback loops that made the case harder to validate.
Repeated delivery returns illustrated the opportunity. Customers in one sector had policies that left deliveries without reception services or access to facilities. Complaints appeared as individual cases, delaying recognition of the shared pattern.
Connecting feedback with operational data
We used customers and accounts as common reference points to connect complaints with operational logs. Different reporting intervals complicated these connections. The dashboard also needed to support investigation from individual customers to patterns across groups.
Spotting and investigating issues
I designed two ways for operational and tactical roles to explore the data:
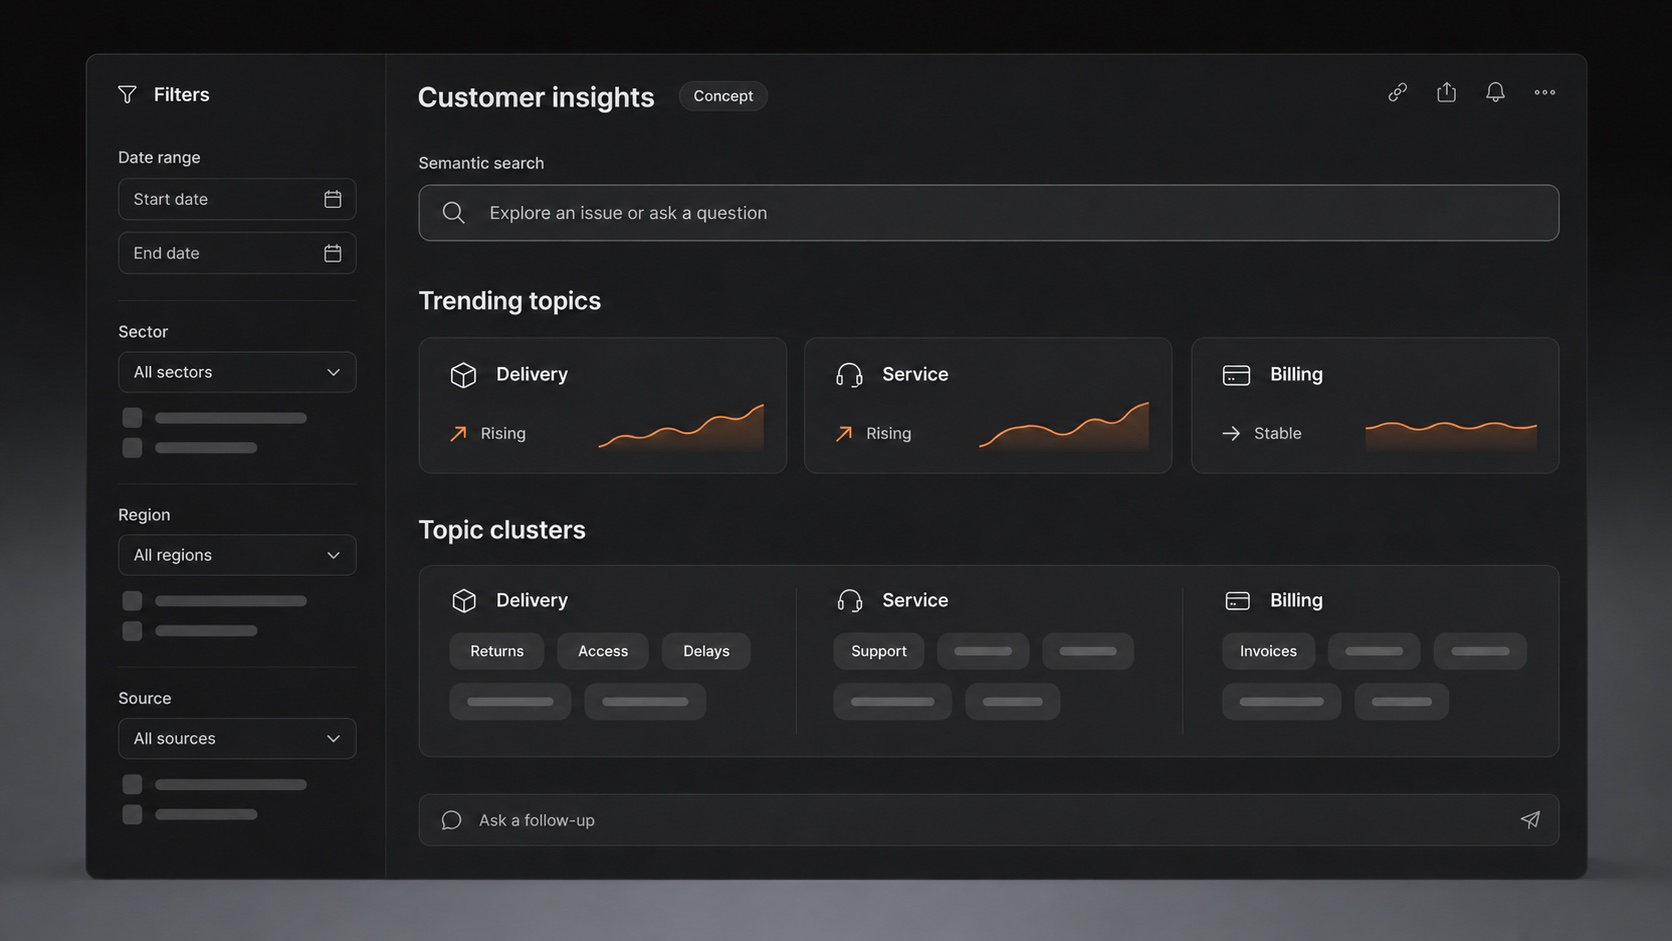
- Spot emerging issues: surface complaint spikes and group them into trending topics.
- Investigate a suspected problem: use semantic search to move from related clusters to individual customers.
Chat enabled follow-up questions for deeper investigation, with an initial capability available in the proof of concept.
The system surfaces patterns and suggests where to look; people investigate and decide what to do. The dashboard supports their judgement rather than replacing it.
I learnt to trust the process
Testing the concept
The proof of concept connected operational data with complaints in a limited sample, adding context and giving a fuller picture of specific cases.
The client continued development internally. The next step was to validate whether the approach could scale to a larger sample.